
Bitcoin (BTC) has been fluctuating within the $40,000 to $45,000 bracket, struggling to break through the key resistance level amid extended market stabilization.
However, a technical analysis of Bitcoin suggests a likelihood of the asset reaching new peaks, based on patterns observed in past price trends.
Notably, Bitcoin is on the verge of completing its inaugural weekly golden cross pattern—a strong indicator of potential long-term price growth.

A golden cross occurs in any market when the shorter-term 50-day moving average crosses above the longer-term 200-week moving average. In the Bitcoin market, the first-ever golden cross is expected this week, assuming there’s no significant decline in BTC’s value leading up to December 25.
Despite Bitcoin’s recent price fluctuations, the emergence of the golden cross is generally seen as a positive sign for the future direction of the asset’s value.
Start of BTC bull run?
As previously mentioned, when the 50-day Simple Moving Average (SMA) exceeds the 200-day SMA of a digital asset, it often signals the onset of an upcoming bullish phase.
Reflecting on historical patterns, BTC’s price behavior is no different; examining past trends can provide valuable insights into potential future price movements. This perspective aligns with a recent analysis shared by crypto analyst TAnalyst on December 22.
#BITCOIN'S BULL RUN BEGINS. pic.twitter.com/QkHrfTOcPT
— TAnalyst (@AurelienOhayon) December 21, 2023
The anticipation is centered around the next Bitcoin halving, projected for 2024, which could potentially mark the beginning of a new market cycle.
Bitcoin price analysis
Currently, BTC is priced at $43,670, reflecting a slight decrease of -0.90% over the last 24 hours. However, this contrasts with its weekly and monthly performance, where it has seen increases of 2.29% and 19.23%, respectively.
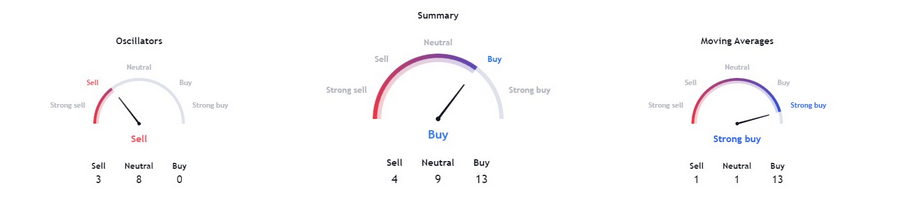
Based on the technical analysis from TradingView, there is an indication of bullish sentiment in various aspects. A synthesis of the one-day metrics shows a predominance of buy signals, achieving a score of 13, which is consistent with the moving averages rating. In contrast, oscillators suggest a sell signal, marked by a lower rating of 3.
Whether these positive technical and historical indicators will be an optimistic sign of things to come remains to be seen.
Disclaimer: The content on this site should not be considered investment advice. Investing is speculative. When investing, your capital is at risk.