
Today, the price of Polygon (MATIC) has risen above $1. This marks a significant development as it begins to emerge from a prolonged downward trend. The coin has been under a descending resistance line for the past 730 days, dating back to its record high.
Even with its recent surge, MATIC remains beneath its annual peak of $1.57. The question now is whether it can achieve a new high before the year concludes.
Polygon Finally Breaks Out
MATIC’s price trajectory has been under a descending resistance trend since its peak of $2.90 in December 2021. This downtrend resulted in a low of $0.32 in June.
Beginning its recovery, MATIC attempted a breakout in February 2023 (marked by a red icon), but it didn’t succeed. Two more attempts in November and December also failed before it finally broke through this week.
The current high of $1.07 is the most significant since April. It’s important to note, however, that MATIC has yet to achieve a weekly close above this resistance trend line.
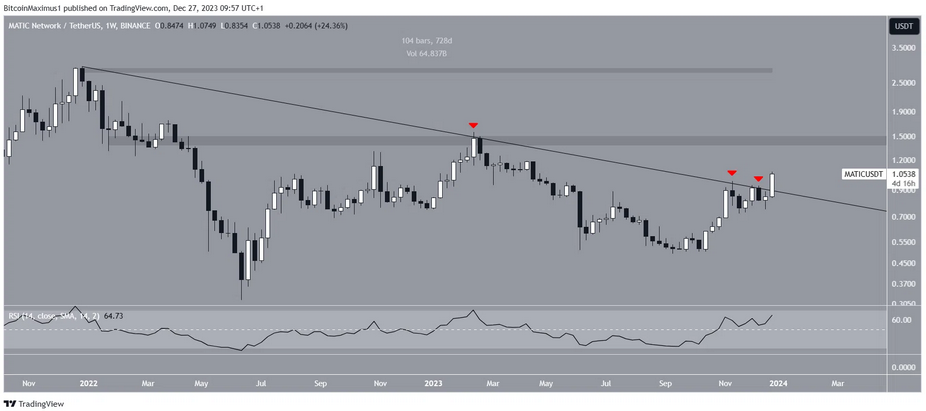
Traders in the market often rely on the Relative Strength Index (RSI) as a tool to gauge momentum, helping them determine if an asset is in overbought or oversold territory for making buying or selling decisions.
When the RSI exceeds 50 and shows an upward trajectory, it typically signals that the market is leaning in favor of the bulls. Conversely, an RSI below 50 indicates bearish dominance.
Currently, the weekly RSI is on the rise and stands above 50, both indicators pointing towards a bullish market trend.
Source: beincrypto.com